SaaS Platform Design
Fleet Management Dashboard
A&K Robotics
A&K Robotics is a company that works on transforming manual vehicles into autonomous self driving robots using intelligent navigating systems. The AOFM dashboard is designed to manage and keep track of the robots by staff at the airport.
My Role
Principle Product Designer
Duration
3 months
Tools
Figma, Miro, Slack
Overview
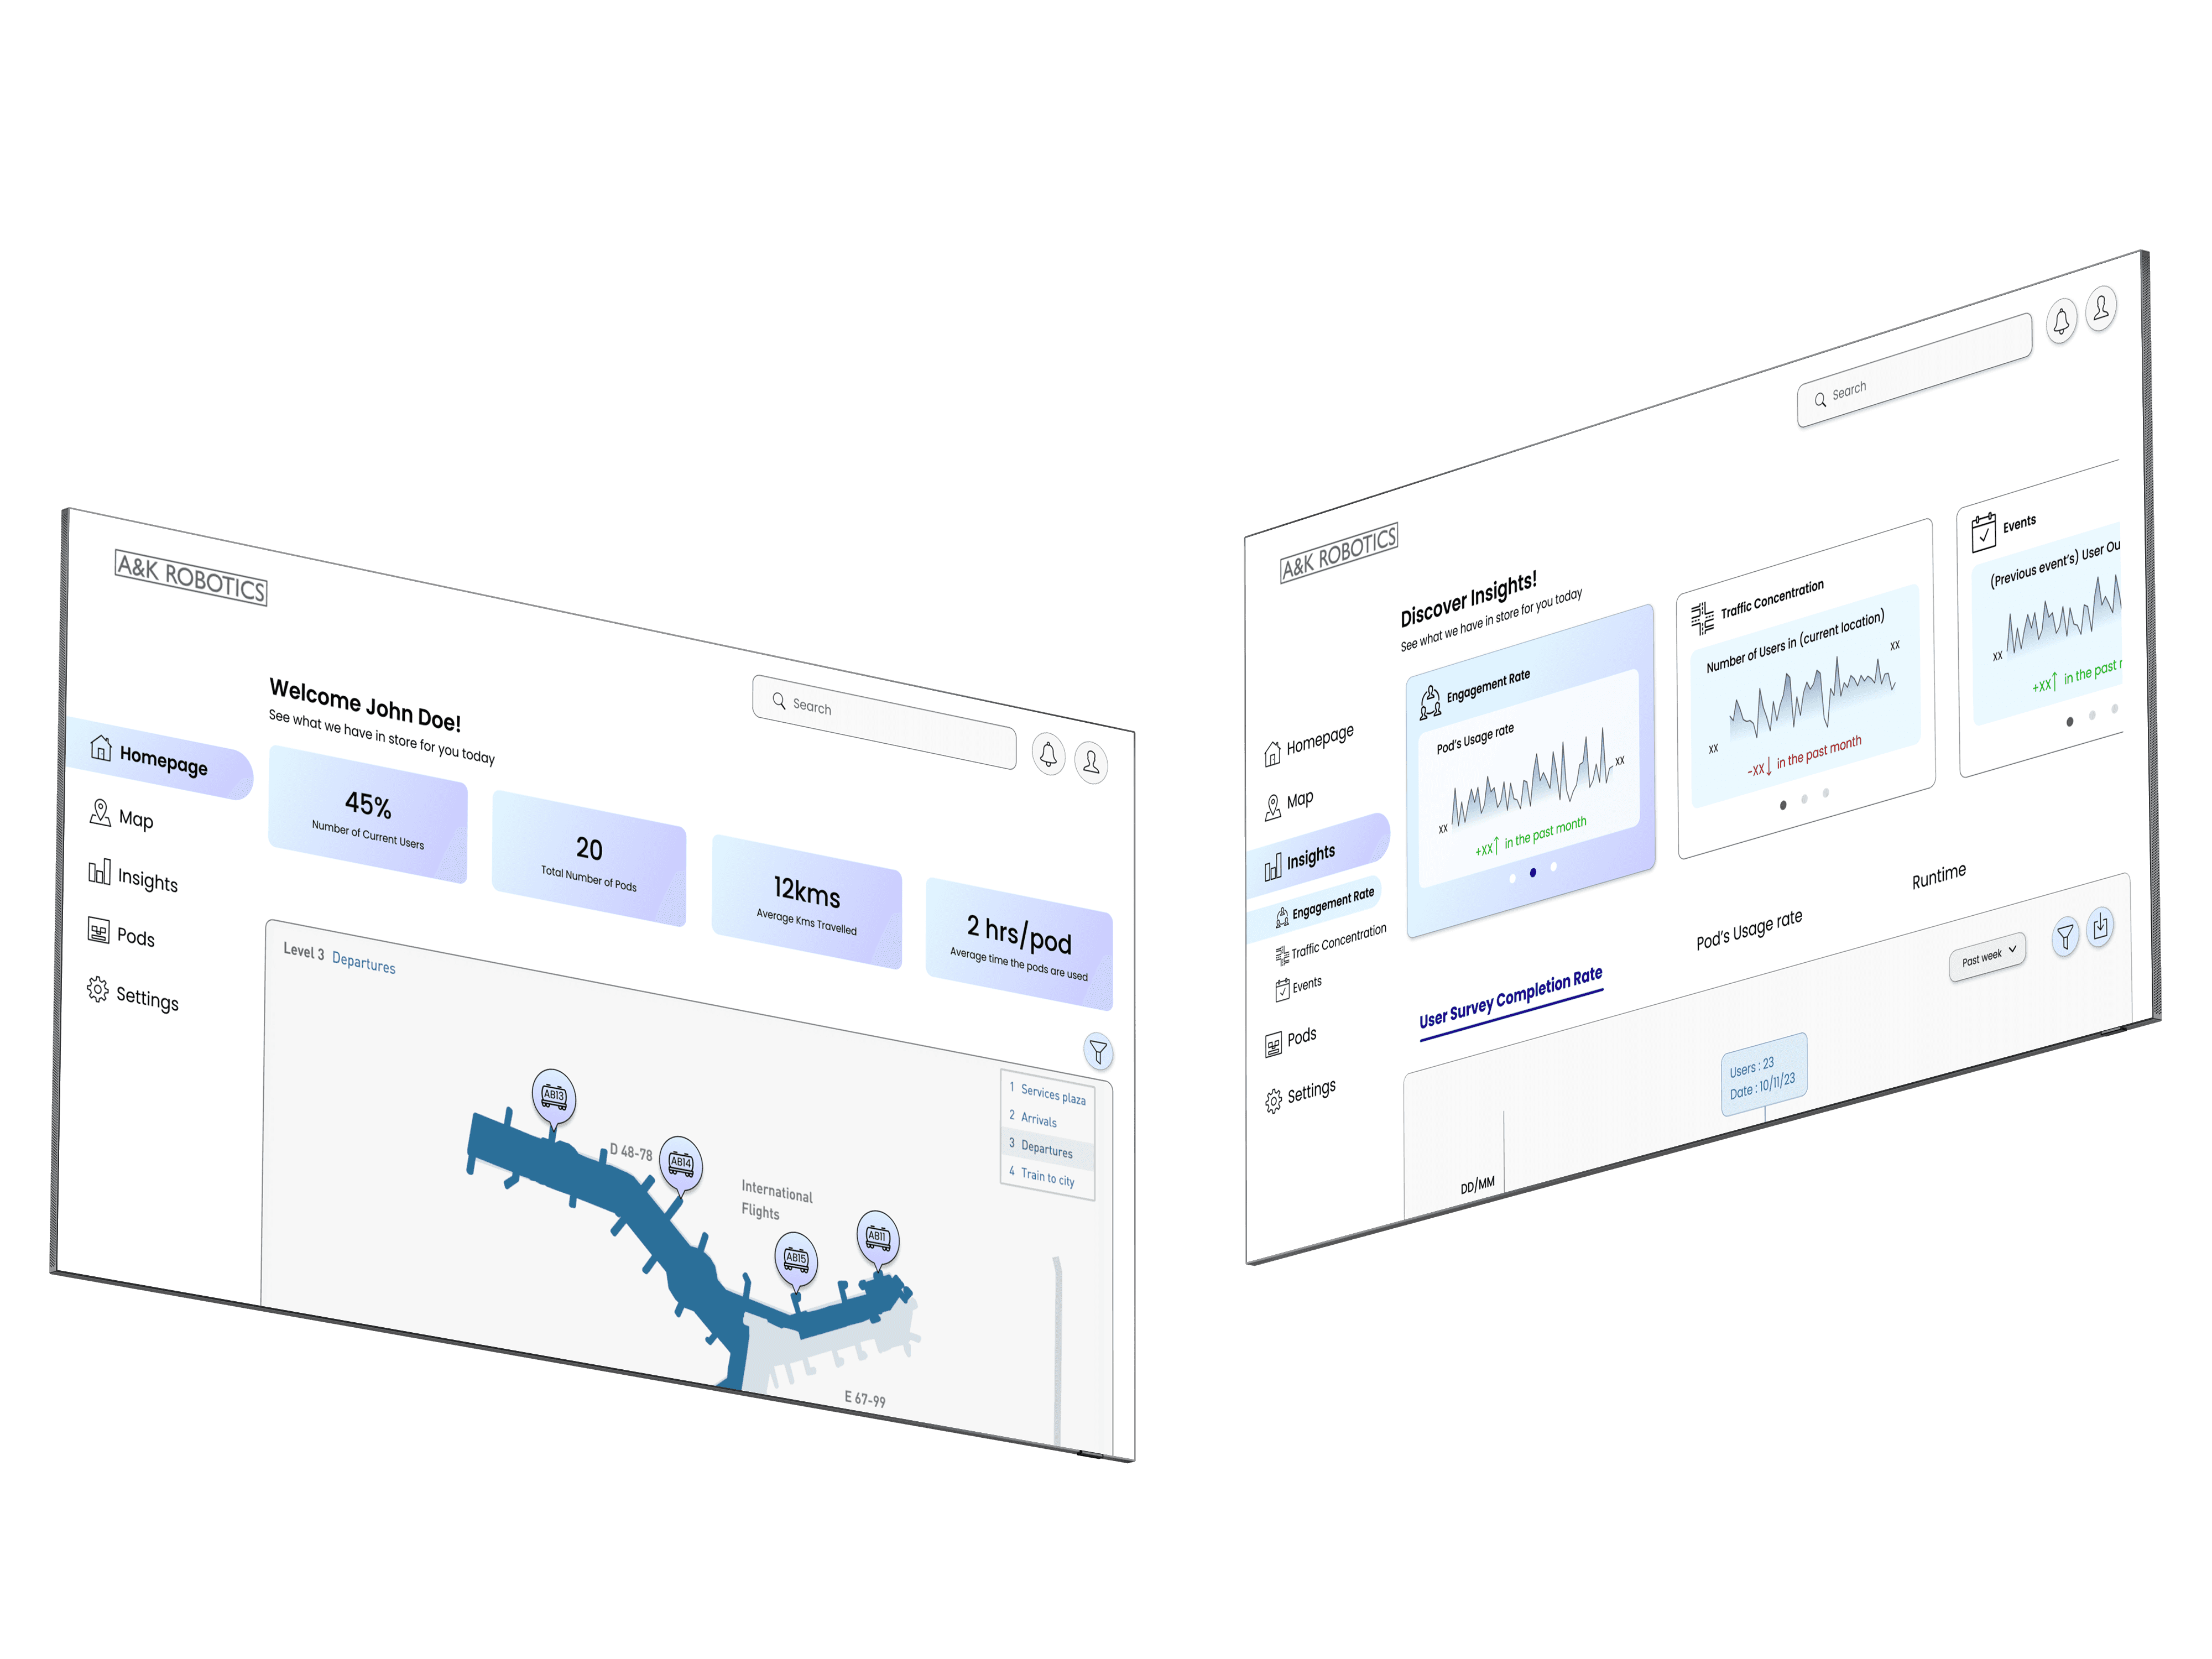
A&K’s product and service offering to their clients, that include airports and other public locations, include robots and fleet management software for staff.
Fleet management is key to operating these robots at scale, where 100s of robots could be operating across a large space such as an airport. Staff require visibility into robot locations and current operations, as well as live and historical statistics.
This created an opportunity for a centralised tracking system which led to the design and deployment of the AOFM dashboard.
I designed the end to end system for staff to access key data points, track metrics, and operate basic functions through the AOFM dashboard. Led 4-phase design process from problem discovery to deployment and post-test iteration.
The mimimum viable product was able to Reduced robot lookup time by 60% through centralized data visualization. Achieved 90% task success rate in usability tests for location tracking and status monitoring. System scaled to support 100+ autonomous robots with seamless interaction patterns.

Tracking the pods
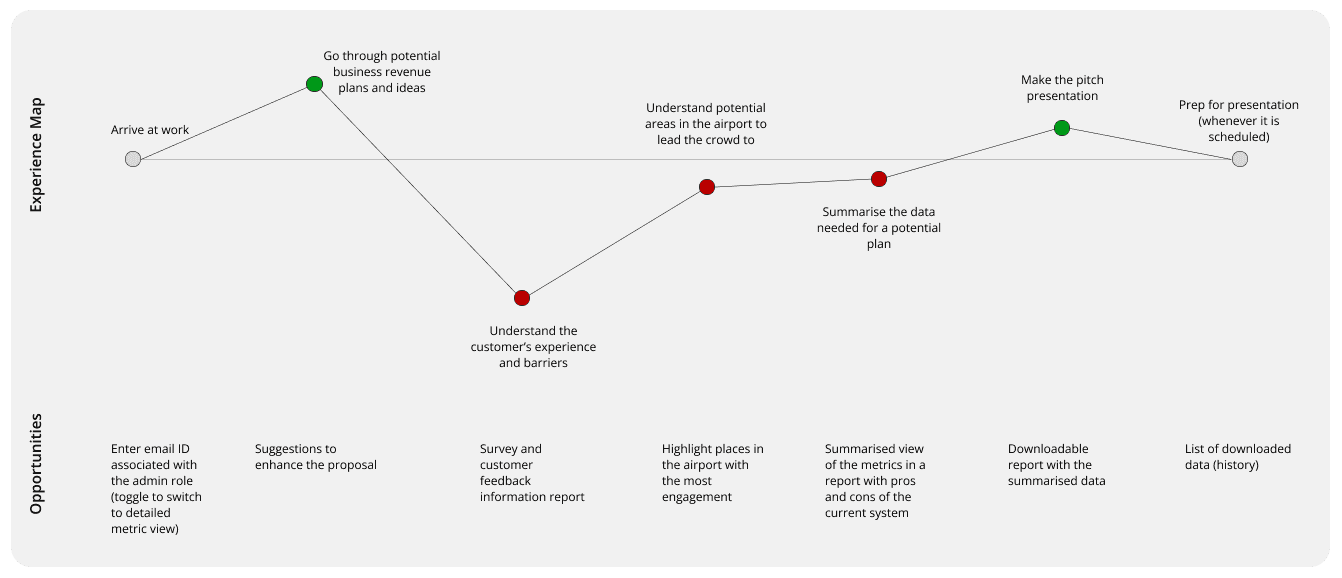
The company’s key user groups are the airport staff and internal manager. By conducting secondary research and interviewing the client groups, I discovered the pain points of the airport staff and the internal managers of A&K robotics.
With the pain points, I compiled their task flows into experience maps and identified opportunities.
Identifying the pods
The company’s key user groups are the airport staff and internal manager. By conducting secondary research and interviewing the client groups, I discovered the pain points of the airport staff and the internal managers of A&K robotics.
With the pain points, I compiled their task flows into experience maps and identified opportunities.
Follow metrics
The company’s key user groups are the airport staff and internal manager. By conducting secondary research and interviewing the client groups, I discovered the pain points of the airport staff and the internal managers of A&K robotics.
With the pain points, I compiled their task flows into experience maps and identified opportunities.
Problem identification
The company’s key user groups are the airport staff and internal manager. By conducting secondary research and interviewing the client groups, I discovered the pain points of the airport staff and the internal managers of A&K robotics.

With the pain points, I compiled their task flows into experience maps and identified opportunities.
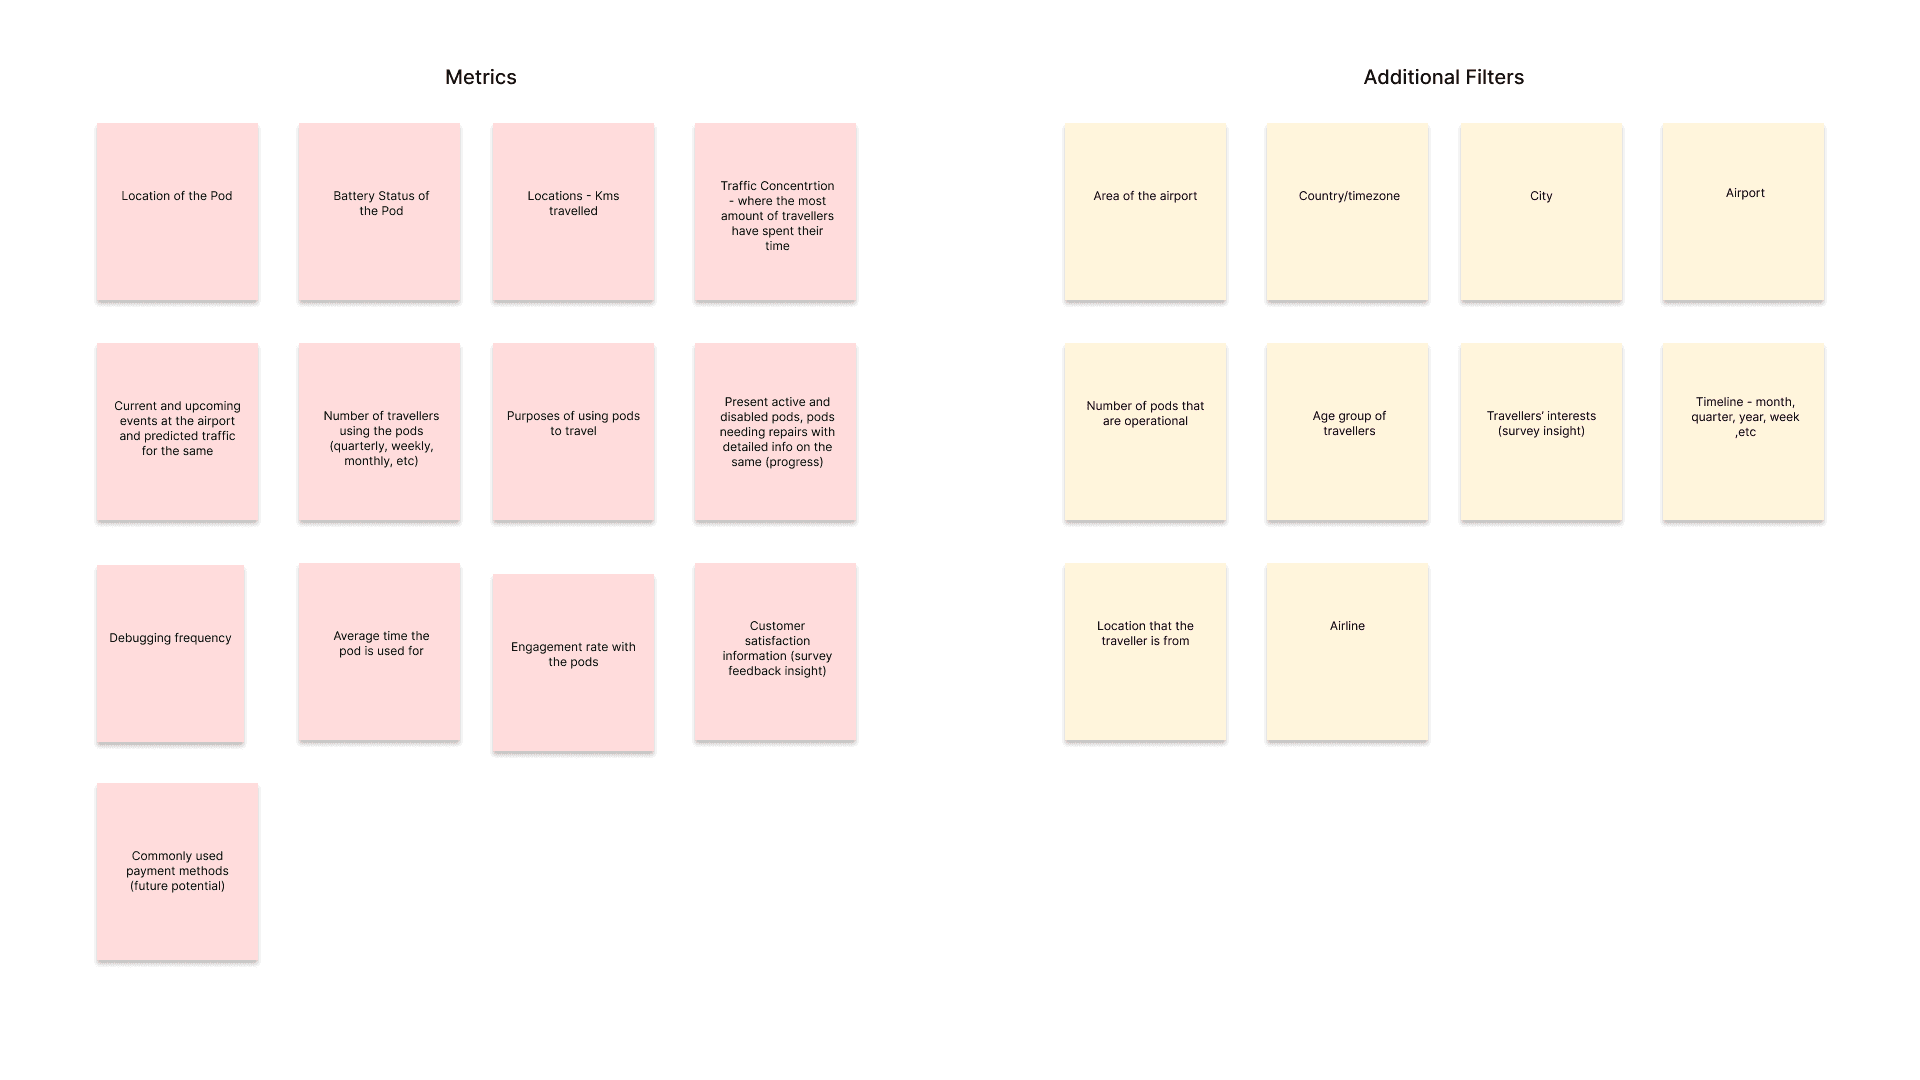
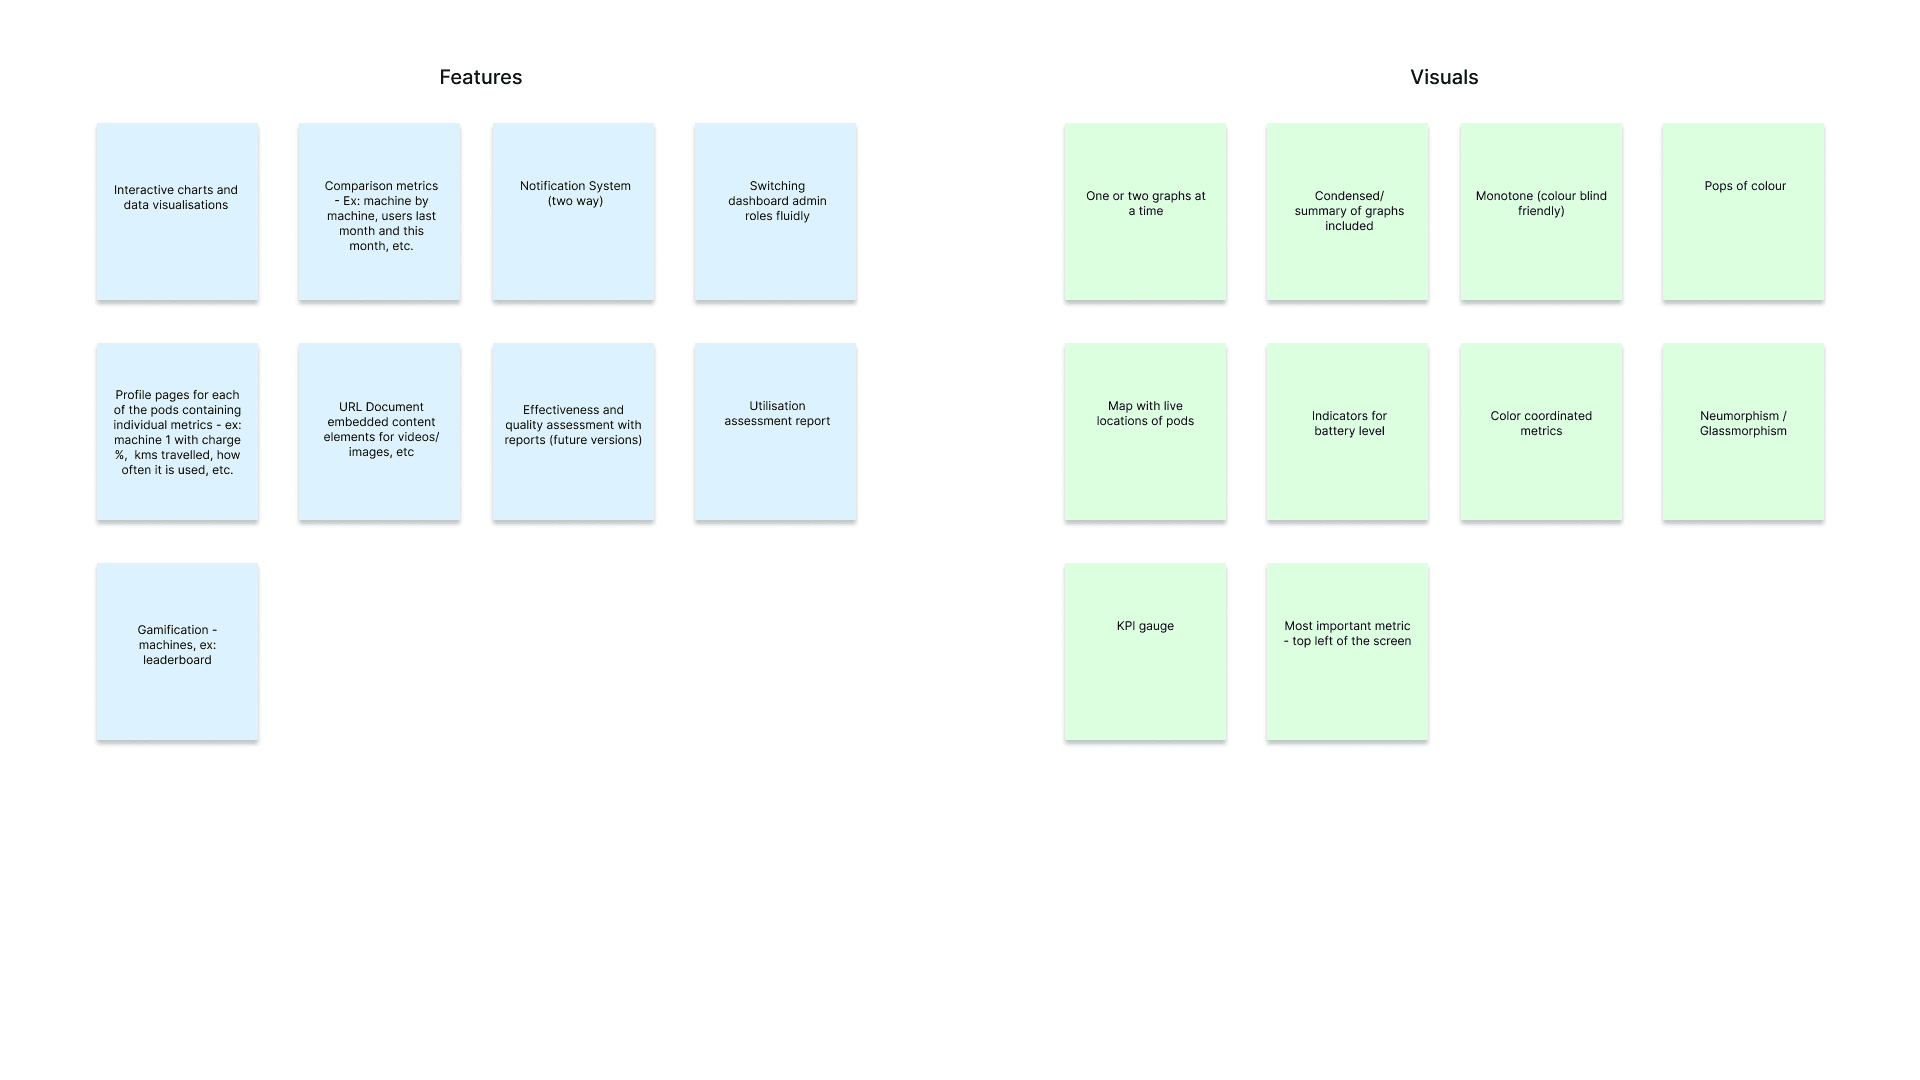
By converting opportunities into features that can be implemented digitally, I began ideating and grouped the features into categories.

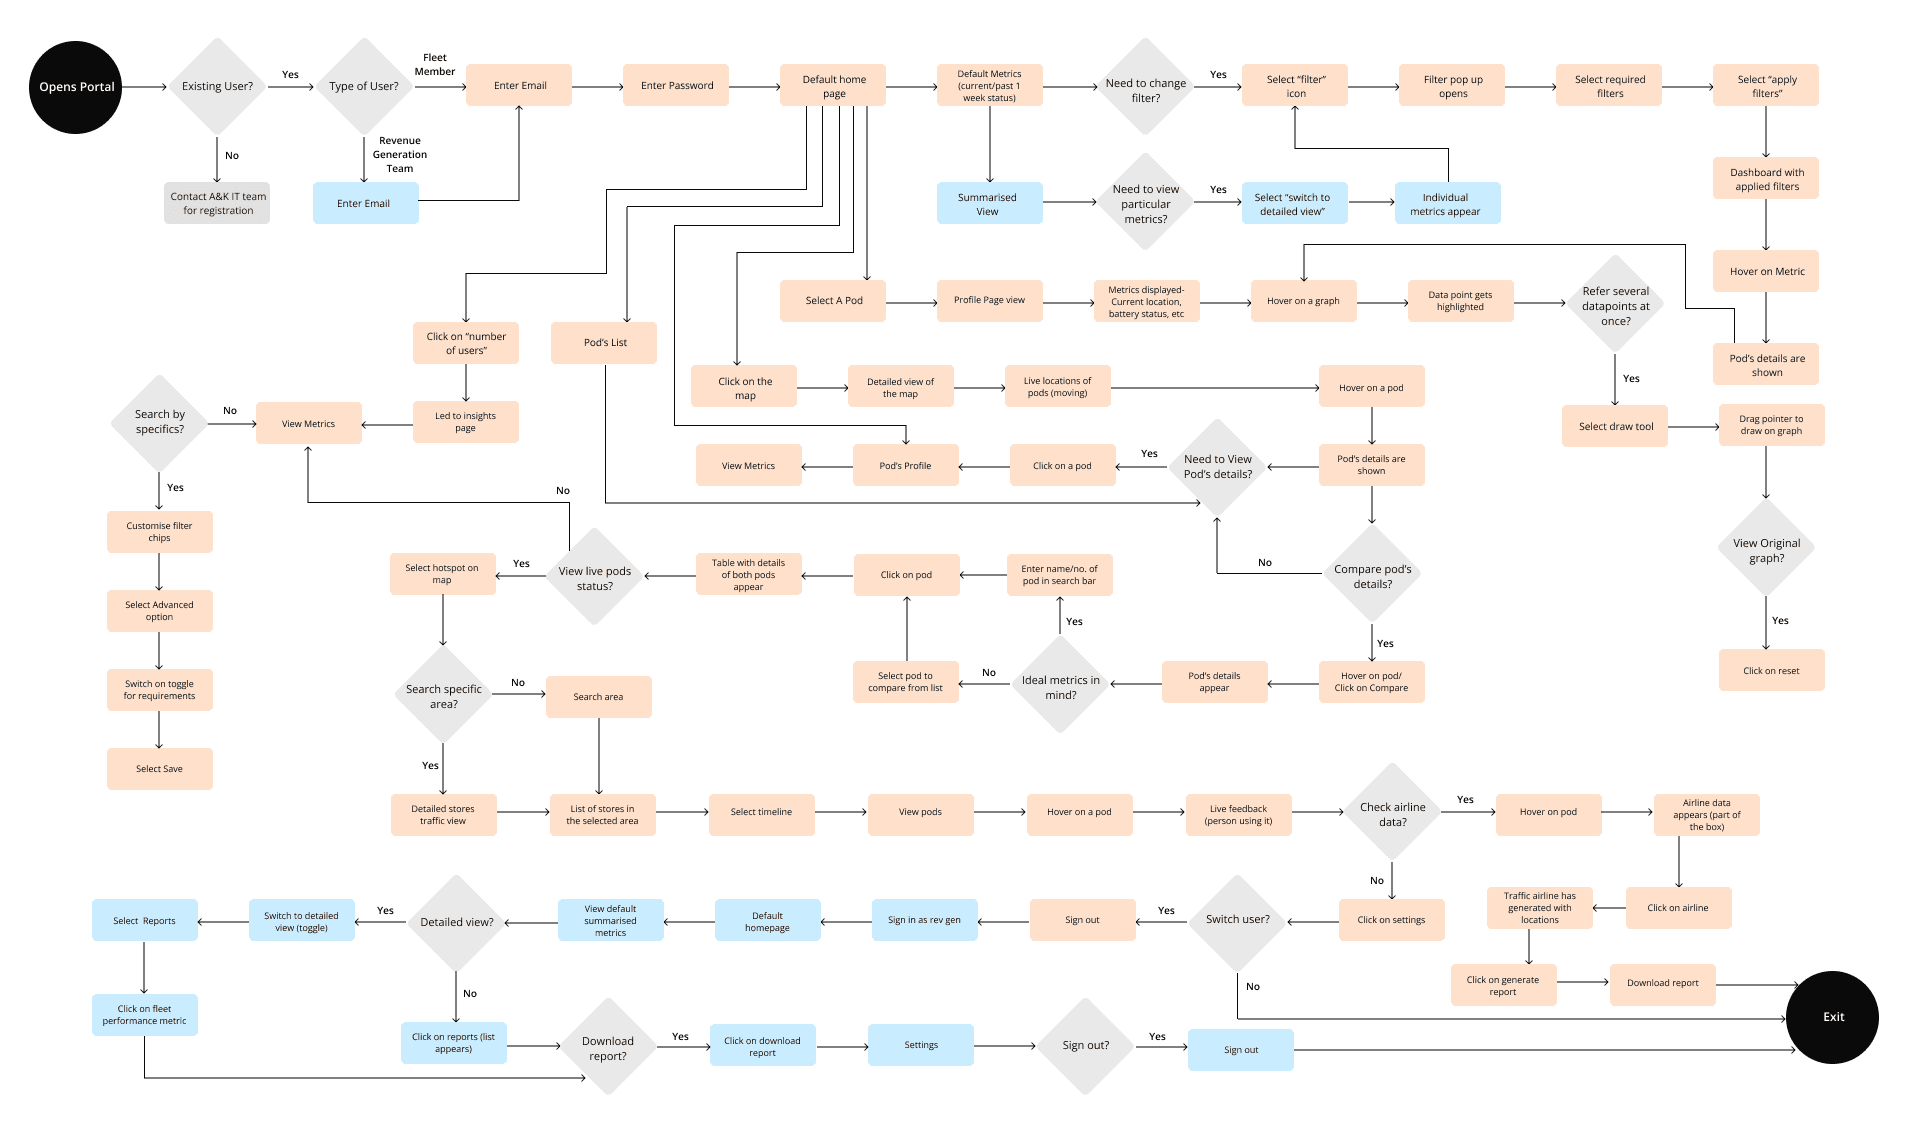
Reimagining tasks
I reimagined the user flow of the website for airport staff and internal managers to see how they use the dashboard with the new features.
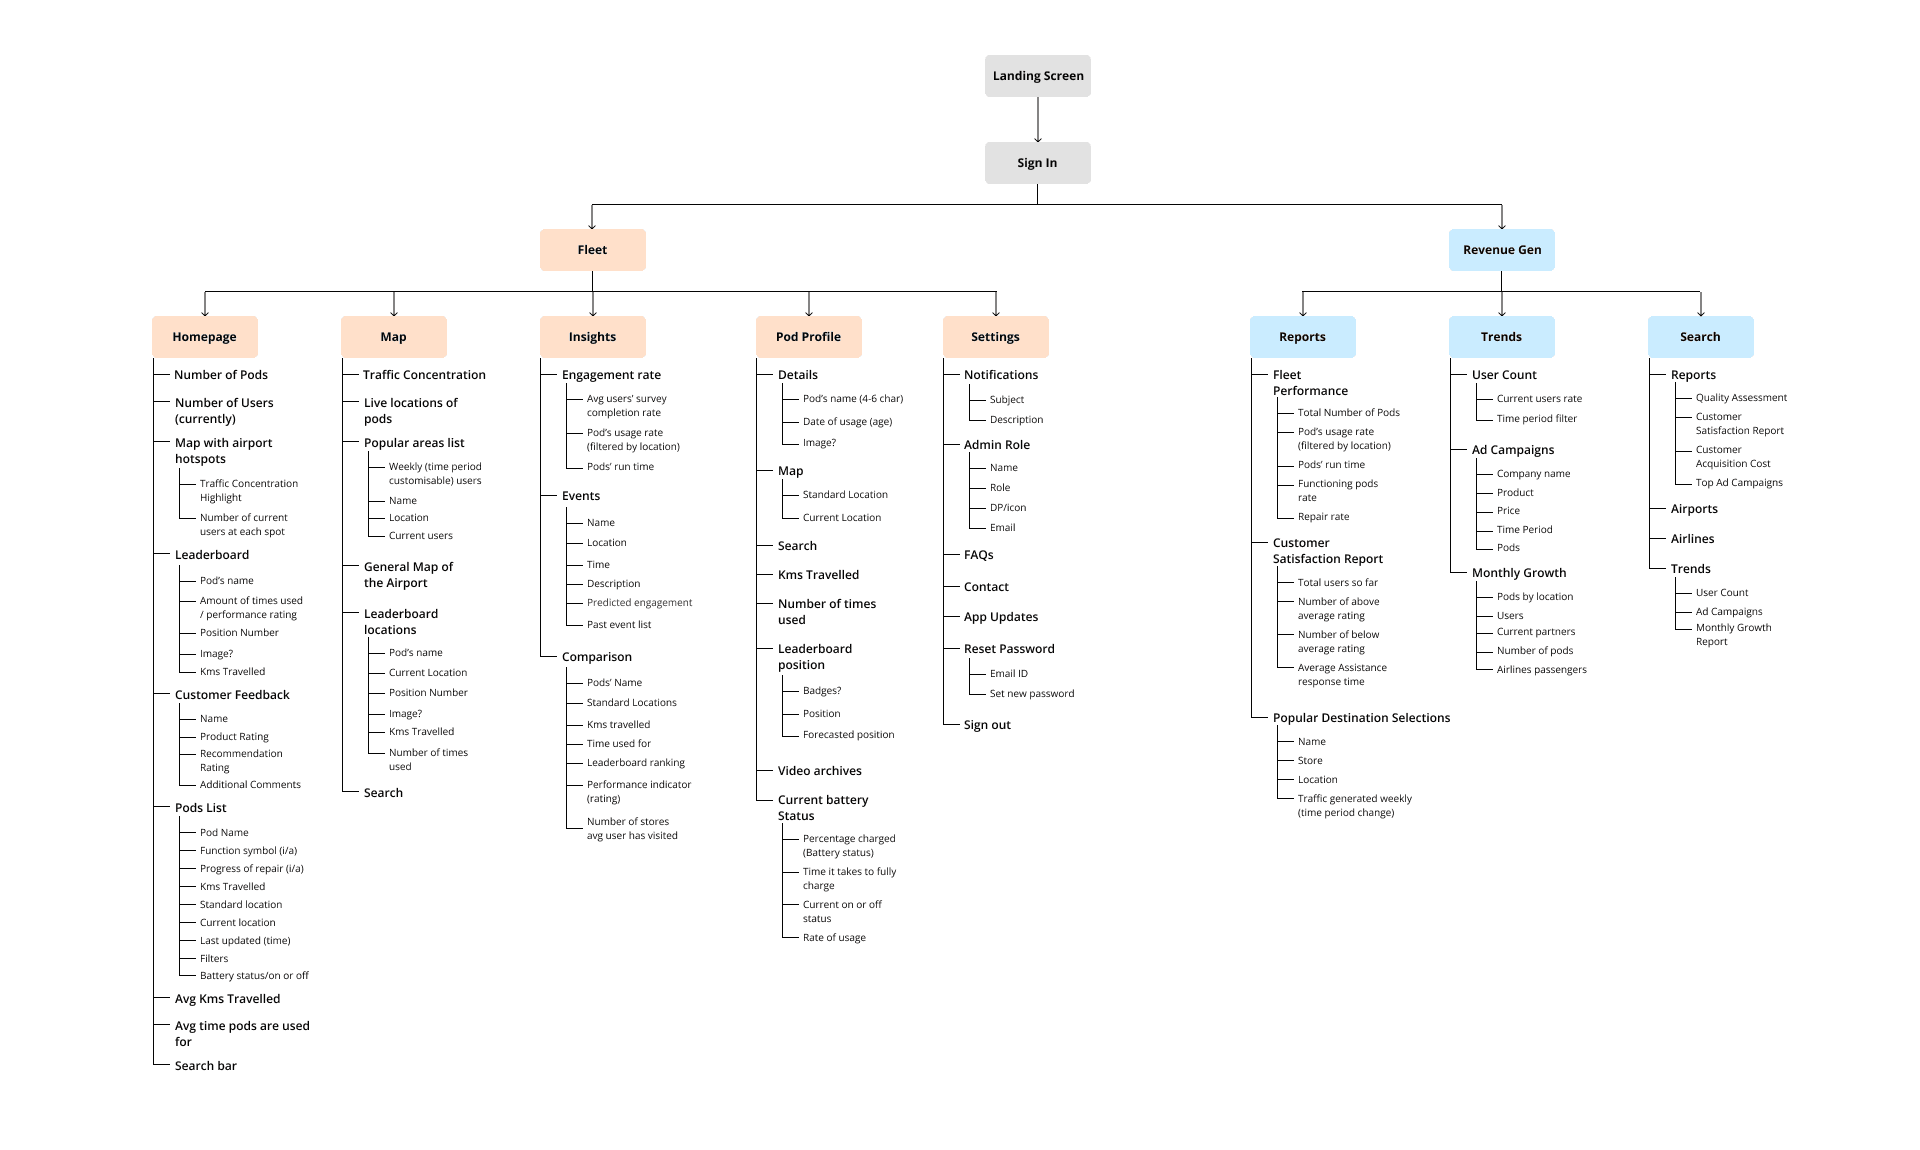
Content hierarchy
I created an information architecture diagram to create hierarchies of the features and place them within the larger context of the website.

Results
Increased user engagement by 30% through intuitive navigation and personalized music recommendations.
Enhanced social sharing by 25%, fostering a community of music enthusiasts.
Improved user satisfaction ratings by 40% after implementing feedback loops.